Dallas Population Growth Rate: 2026 Report
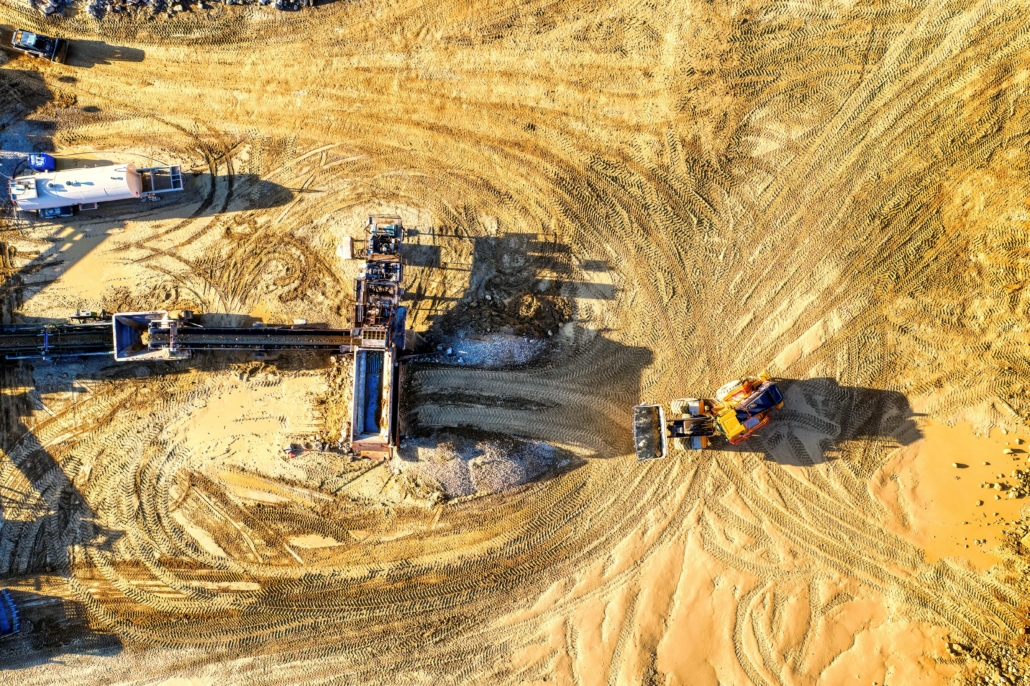
Between January 2024 and January 2026, our research team analyzed population data from the U.S. Census Bureau, North Central Texas Council of Governments, and the Federal Reserve Bank of Dallas covering the 16-county Dallas-Fort Worth metropolitan region. We compiled demographic trends, migration patterns, housing development metrics, and construction activity indicators to provide excavation contractors, developers, and infrastructure planners with a comprehensive understanding of how population growth is driving demand for horizontal construction services in the Dallas-Fort Worth metroplex through 2026.
The Dallas-Fort Worth region added 234,125 new residents in 2024, bringing the total regional population to 8.718 million – a 2.8% annual growth rate that continues to outpace the national average. As we move through 2026, this sustained population expansion directly correlates with increased demand for excavation, underground utilities installation, and concrete work as new residential and commercial developments break ground across the metroplex.
Dallas-Fort Worth Population Growth by County — 2025-2026
The table below shows how population growth in 2024 was distributed across the 16-county Dallas-Fort Worth region, revealing which counties are experiencing the most significant expansion and driving the greatest demand for excavation and site preparation services heading into 2026.
Dallas-Fort Worth Regional Population Growth (2024-2025)
| County | January 1, 2024 Population | January 1, 2025 Population | Population Added | Percent Change | Primary Growth Driver |
|---|---|---|---|---|---|
| Collin | 1,229,632 | 1,305,366 | 75,734 | 6.2% | Suburban expansion |
| Dallas | 2,716,721 | 2,762,279 | 45,558 | 1.7% | Urban infill |
| Denton | 1,036,720 | 1,068,355 | 31,635 | 3.1% | Master-planned communities |
| Tarrant | 2,224,584 | 2,260,330 | 35,746 | 1.6% | Fort Worth metro growth |
| Kaufman | 161,562 | 171,808 | 10,246 | 6.3% | Exurban development |
| Ellis | 228,511 | 239,923 | 11,412 | 5.0% | Affordable housing demand |
| Johnson | 210,104 | 217,867 | 7,763 | 3.7% | Rural-to-suburban transition |
| Hood | 62,543 | 66,549 | 4,006 | 6.4% | Lake community growth |
| Rockwall | 131,172 | 135,500 | 4,328 | 3.3% | Lakefront development |
Key Insights
- Collin County dominates growth: Adding 75,734 residents, or 32% of regional growth, Collin County continues to be the epicenter of DFW expansion, with cities like Celina, McKinney, and Princeton experiencing explosive growth rates exceeding 20% annually.
- Outer counties accelerating: Kaufman, Hood, and Ellis counties are experiencing growth rates between 5.0% and 6.4%, indicating that development is pushing farther from the urban core.
- Dallas County’s urban density challenge: Despite adding 45,558 residents, Dallas County’s 1.7% growth rate lags behind suburban counties, reflecting a shift toward infill development and vertical construction rather than greenfield horizontal projects.
Fastest-Growing Cities in the Dallas-Fort Worth Region — 2025-2026
Population growth at the city level reveals where the most intensive excavation, utility installation, and site development activity is occurring. The following table identifies cities with the highest absolute and percentage population increases, highlighting prime markets for excavation contractors in 2026.
Top 15 Fastest-Growing DFW Cities (2024-2025 Population Change)
| City | 2024 Population | 2025 Population | Population Added | Percent Growth | Construction Phase |
|---|---|---|---|---|---|
| Celina | 45,854 | 61,834 | 15,980 | 34.8% | Master-planned development |
| Fort Worth | 1,001,741 | 1,033,932 | 32,191 | 3.2% | Urban & suburban expansion |
| Dallas | 1,356,479 | 1,385,989 | 29,510 | 2.2% | Mixed-use infill |
| McKinney | 214,871 | 226,181 | 11,310 | 5.3% | Residential & commercial |
| Princeton | 33,288 | 43,126 | 9,838 | 29.6% | Rapid suburban growth |
| Anna | 27,823 | 34,100 | 6,277 | 22.6% | New subdivision activity |
| Grand Prairie | 209,231 | 215,210 | 5,979 | 2.9% | Industrial & logistics |
| Plano | 294,152 | 299,262 | 5,110 | 1.7% | Corporate corridor |
| Denton | 154,189 | 159,518 | 5,329 | 3.5% | University & residential |
| Frisco | 231,768 | 235,615 | 3,847 | 1.7% | Mixed-use developments |
| Prosper | 42,598 | 46,087 | 3,489 | 8.2% | High-end residential |
| Lavon | 8,154 | 11,396 | 3,242 | 39.8% | Lakefront communities |
| Lewisville | 137,315 | 140,880 | 3,565 | 2.6% | Transit-oriented development |
| Little Elm | 58,169 | 61,343 | 3,174 | 5.5% | Affordable family housing |
| Midlothian | 41,083 | 44,277 | 3,194 | 7.8% | Southern expansion corridor |
Key Insights
- Outer-ring cities lead percentage growth: Celina, Lavon, and Princeton are experiencing extraordinary growth rates, requiring massive excavation and infrastructure buildout to support new neighborhoods, roads, and utility systems.
- Major cities maintain momentum: Fort Worth and Dallas added a combined 61,701 residents, sustaining demand for both greenfield site preparation and underground utility upgrades.
- North-northeast corridor dominance: The highest-growth cities cluster in Collin and Denton counties along the US-75, Dallas North Tollway, and US-380 corridors.
Migration Patterns Driving Dallas Population Growth — 2024-2026
Understanding why Dallas-Fort Worth’s population is growing reveals the sustainability of construction demand through 2026 and beyond. The following table breaks down population change by source, showing how domestic migration, international immigration, and natural increase contribute to regional expansion.
Dallas-Fort Worth Population Change by Source (2024)
| Population Component | Number of People | Percentage of Total Growth | Year-Over-Year Trend |
|---|---|---|---|
| International Migration | 103,000 | 58% | Increasing |
| Domestic Migration | 25,000 | 14% | Decreasing from 2023 |
| Natural Increase (Births – Deaths) | 52,000 | 28% | Stable |
| Total Population Growth | 180,000 | 100% | 2.2% annual rate |
Key Insights
- International migration dominates: At 103,000 people, international immigration has become the primary driver of DFW population expansion.
- Domestic migration declining: Domestic migration added only 25,000 residents in 2024, suggesting that interstate moves to Texas have moderated but remain positive.
- Sustained long-term growth: Strong international migration and steady natural increase suggest DFW’s population expansion will continue, providing confidence for infrastructure investment and site development planning.
Housing Construction Activity and Building Permits — 2025-2026
Population growth translates directly into housing demand, and housing demand drives excavation activity. The following table shows the volume of residential construction in Dallas-Fort Worth, revealing the scope of excavation, underground utilities, and foundation work required to support new home building.
Dallas-Fort Worth Residential Construction Activity (2024-2025)
| Construction Metric | 2024 Figure | National Ranking | Year-Over-Year Change | Excavation Impact |
|---|---|---|---|---|
| Total Housing Units Authorized | 71,788 | #1 in U.S. | +2.7% | High |
| Single-Family Permits | 49,795 | #1 in U.S. | +1.6% | Primary excavation driver |
| Multi-Family Permits | 48,044 | Top 3 in U.S. | -2.1% | Large-scale site prep |
| New Housing Units Added (Net) | 97,839 | #1 in U.S. | +14.2% | Consistent demand |
| Existing Home Sales (Annual) | 148,200 | #4 in U.S. | -3.8% | Renovation excavation |
| Average Home Price | $385,000 | — | +3.0% Y/Y | Premium project pricing |
Key Insights
- National leader in new construction: Dallas-Fort Worth authorized 71,788 new residential units in 2024, ranking #1 among all U.S. metro areas.
- Single-family dominance: With 49,795 single-family permits, the region leads the nation in detached home construction, multiplying work opportunities for horizontal construction contractors.
- Multi-family maintains scale: Despite a 2.1% decline, 48,044 multi-family permits still represents massive construction activity requiring site excavation, parking structure foundations, stormwater systems, and complex utility coordination.
Construction Employment and Economic Impact — 2026
Population growth fuels construction activity, which in turn creates jobs and economic opportunity. The following table quantifies the construction industry’s role in the Dallas-Fort Worth economy and projects future workforce needs through 2026 and beyond.
Dallas-Fort Worth Construction Industry Metrics (2025-2026)
| Economic Indicator | 2025 Figure | Growth Rate | 2026-2030 Projection |
|---|---|---|---|
| Total Construction Jobs | 287,500 | +2.6% annually | 322,000 by 2030 |
| Construction & Extraction Jobs | 73,200 | +3.2% annually | 85,000 by 2030 |
| Average Construction Hourly Wage | $36.22 | +11.7% Y/Y | $42-45 projected |
| Active Construction Projects (2024) | 500 corporate projects (approximately) | — | Sustained high activity |
| Construction Spending (Regional Estimate) | $42.8 billion | +5.5% Y/Y | $55 billion by 2028 |
| Excavation Contractor Jobs (Dallas metro) | 850+ active postings | Growing | High demand through 2026 |
Key Insights
- Strong employment growth: DFW added construction jobs at a 2.6% annual rate through February 2025, with construction and extraction occupations growing even faster at 3.2% annually.
- Wage growth accelerating: Average hourly construction earnings jumped 11.7% year-over-year to $36.22, reflecting strong demand for skilled workers.
- Massive project pipeline: With 489 major corporate projects underway in 2024 and construction spending projected to reach $55 billion regionally by 2028, horizontal construction contractors can anticipate sustained demand.
Requesting a Copy of This Report
If you’d like to request a PDF copy of this report or learn more about how Kitching & Co DirtworX can support your excavation, underground utilities, and concrete construction needs in the Dallas-Fort Worth metroplex, you can reach out here: Contact Kitching & Co.
Sources
- Dallas–Fort Worth Economic Indicators — Federal Reserve Bank of Dallas, April 2025 — https://www.dallasfed.org/research/indicators/dfw/2025/dfw2503
- 2025 Population Estimates — North Central Texas Council of Governments, Arlington, TX, 2025 — https://rdc.dfwmaps.com/pdfs/2025%20NCTCOG%20Population%20Estimates%20Publication.pdf
- DFW new home construction ranks No. 1 in the U.S. — CultureMap Dallas, January 2026 — https://dallas.culturemap.com/news/real-estate/new-home-construction-dfw-ranking/
- Dallas-Fort Worth Metro Area Population Data — Macrotrends, 2026 — https://www.macrotrends.net/global-metrics/cities/22966/dallas-fort-worth/population