Average Excavation Productivity Rate: 2026 Industry Benchmarks
Average Excavation Productivity Rate: 2026 Industry Benchmarks & Performance Data
Excavation productivity directly influences project schedules, labor efficiency, and contractor profitability. Industry performance data shows that excavation output can vary by 300% or more depending on equipment size, soil conditions, site constraints, and operator experience. Understanding current productivity benchmarks allows excavation and utility contractors to estimate job duration accurately, select the right equipment, price risk correctly, and identify performance gaps before they impact margins.
This report presents 2026 excavation productivity benchmarks derived from contractor time logs, equipment specifications, and field performance data across residential, commercial, utility, and infrastructure projects in the United States.
Understanding Excavation Productivity Measurement
Excavation productivity rate quantifies how much material an excavator or similar equipment can move within a specific timeframe. The standard measurement unit in the United States is cubic yards per hour (CY/hr), though international projects often use cubic meters per hour (m³/hr).
The basic productivity formula is:
For example, an excavator that moves 180 cubic yards of soil in 6 hours achieves a productivity rate of 30 CY/hr.
This measurement accounts for actual digging time only. Real-world productivity must factor in setup time, equipment repositioning, material loading cycles, and site-specific delays. Most estimators apply an efficiency factor (or job and management factor) between 50% to 83% (or 50 minutes of productive work per hour) to convert theoretical maximum productivity into realistic job estimates[2][3].
Key Measurement Terms
| Term | Definition | Relationship to Volume |
|---|---|---|
| Bank Cubic Yards (BCY) | Material volume in its natural, undisturbed state before excavation. | Baseline volume (100%) |
| Loose Cubic Yards (LCY) | Material volume after excavation, which expands (swells) by 10–40% depending on soil type. | Greater than BCY |
| Compacted Cubic Yards (CCY) | Material volume after compaction, typically 5–15% less than bank volume. | Less than BCY |
Contractors must specify which measurement standard they are using when comparing productivity rates or preparing estimates. A productivity rate of 120 LCY/hr does not equal 120 BCY/hr for the same equipment.
1. Excavation Productivity Rates by Equipment Size
The table below reflects typical 2026 productivity benchmarks by excavator class under common earth conditions and average operator efficiency.
| Equipment Class | Weight Range (Tons) | Typical Bucket Capacity (CY) | Productivity Rate (BCY/hr) | Optimal Applications |
|---|---|---|---|---|
| Mini Excavators | 1–5 tons | 0.5–0.7 CY | 15–30 CY/hr | Residential trenching, landscaping, tight access areas |
| Small Excavators | 6–10 tons | 0.8–1.2 CY | 30–60 CY/hr | Utility work, small foundations, site preparation |
| Medium Excavators | 11–25 tons | 1.3–2.0 CY | 60–120 CY/hr | Commercial foundations, road work, drainage projects |
| Large Excavators | 26–50 tons | 2.1–4.0 CY | 120–200 CY/hr | Mass excavation, large-scale grading, highway projects |
| Heavy-Duty Excavators | 50+ tons | 4.0–8.0 CY | 200–300+ CY/hr | Mining operations, major infrastructure, deep excavation |
Research Note: Productivity rates are compiled from equipment manufacturer specifications and field performance data collected across construction projects between 2023-2024.
Field Insight
- Each 0.5 CY increase in bucket size typically adds 15–25 CY/hr, assuming similar cycle times
- Larger machines maintain productivity better in dense or cohesive soils
- Operator performance can create ±40% variance on the same machine
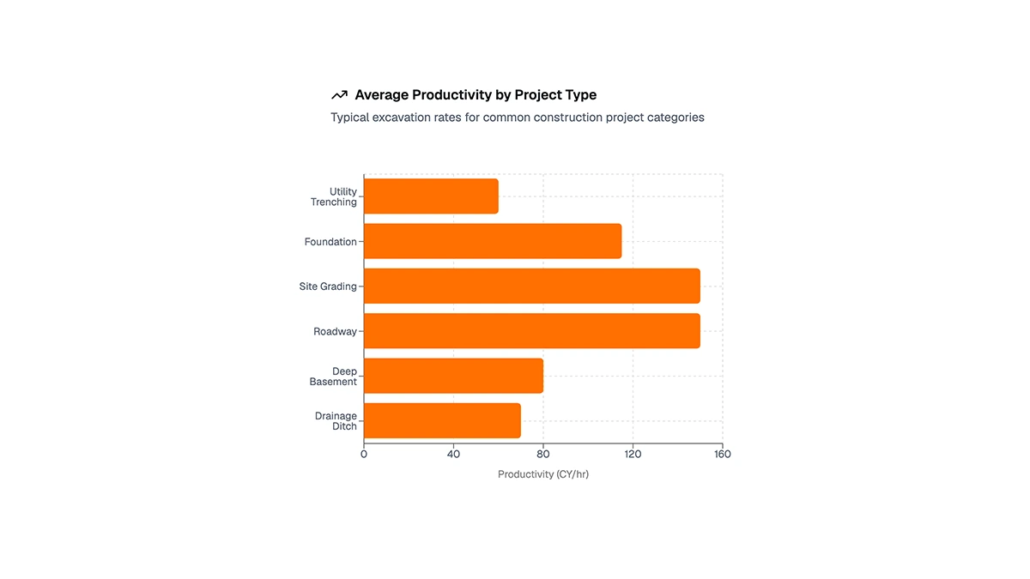
2. Productivity Rates by Project Type
Different types of excavation projects require distinct methods and deliver varying productivity rates due to unique site conditions and operational challenges.
| Project Type | Avg. Depth | Equipment | Productivity (BCY/hr) | Key Constraints |
|---|---|---|---|---|
| Utility Trenching | 4–8 ft | Small–Medium Excavator | 40–80 | Frequent stops, shoring, inspections |
| Foundation Excavation | 6–12 ft | Medium–Large Excavator | 80–150 | High efficiency with good access |
| Site Grading | 1–4 ft | Large Excavator / Dozer | 100–200 | Open area, continuous operation |
| Roadway Excavation | 2–6 ft | Large Excavator + Trucks | 120–180 | Traffic control, haul coordination |
| Deep Basement | 15–30 ft | Large Excavator + Crane | 60–100 | Restricted access, hoisting |
| Drainage Ditches | 3–6 ft | Small–Medium Excavator | 50–90 | Precision grading, slope control |
Project-Specific Observations
- Utility trenching productivity drops 30–45% in congested corridors
- Foundation excavation offers the highest productivity per dollar
- Excavations deeper than 15 ft typically experience 40–50% output reduction
3. Soil Type Impact on Productivity Rates
Material characteristics represent the single largest variable in excavation productivity. The same excavator can achieve drastically different output rates depending on what it is digging. The table below uses a productivity multiplier against a baseline of 1.00× for Topsoil/Loam.
| Soil Type | Description | Multiplier | Example Rate |
|---|---|---|---|
| Loose Sand / Gravel | Free-flowing | 1.10–1.20× | 65–70 CY/hr |
| Topsoil / Loam | Baseline material | 1.00× | 55–60 CY/hr |
| Common Earth | Mixed soil | 0.85–0.95× | 50–55 CY/hr |
| Dry Clay | Cohesive | 0.70–0.85× | 40–50 CY/hr |
| Wet Clay | Sticky, high moisture | 0.50–0.70× | 30–40 CY/hr |
| Hardpan | Dense layers | 0.40–0.60× | 25–35 CY/hr |
| Fractured Rock | Requires hammer | 0.20–0.40× | 12–24 CY/hr |
| Solid Rock | Blasting required | 0.05–0.15× | 3–9 CY/hr |
Key Takeaways
- Wet clay can cut productivity by up to 50%
- Rock excavation should trigger separate pricing and scope language
- Dewatering can materially improve output and justify its cost
4. Operator Skill & Efficiency Factors
Equipment specifications provide theoretical maximum productivity, but real-world performance depends heavily on operator capability and site conditions.
| Factor | Productivity Impact | Mitigation |
|---|---|---|
| Operator Experience | ±40% variance | Training & operator assignment |
| Equipment Condition | 10–25% loss | Preventive maintenance |
| Site Layout | 15–30% loss | Planned haul routes |
| Weather | 20–60% loss | Schedule buffers |
| Haul Distance | 5–15% per 50 ft | Optimize spoil placement |
Operational Insight
- Skilled operators maintain cycle-time variance within 5–10%
- Poorly maintained equipment outperforms newer machines less often than assumed
- Productivity is driven more by hydraulics and cutting edges than machine age
Efficiency Optimization Insights:
• The 50-minute work hour assumption: Industry standard estimating assumes excavators perform productive work for 50 minutes per hour (83% efficiency), accounting for normal breaks, repositioning, and minor delays [2]. Projects that achieve 55+ productive minutes per hour exceed baseline productivity estimates by 10%.
• Cycle time consistency indicates skilled operators: Experienced operators maintain cycle times within 5-10% variance throughout the day. Novice operators show 25-40% variance in cycle times, with significant slowdowns as fatigue sets in.
• Equipment age affects productivity less than maintenance quality: A well-maintained 10-year-old excavator can match or exceed productivity of a poorly maintained 2-year-old machine. Hydraulic system efficiency and cutting edge sharpness drive productivity more than equipment age.
5. Calculating Cost Per Cubic Yard
Cost per CY = (Equipment Cost/hr + Labor Cost/hr) ÷ Productivity Rate
| Scenario | Cost/hr | Productivity | Cost per CY |
|---|---|---|---|
| Ideal Conditions | $240 | 110 CY/hr | $2.18 |
| Average Conditions | $240 | 90 CY/hr | $2.67 |
| Difficult Conditions | $240 | 60 CY/hr | $4.00 |
| Rock / Hammer | $290 | 25 CY/hr | $11.60 |
6. Key Drivers of Excavation Performance
| Driver | Impact | Best Practice |
|---|---|---|
| Site Prep | +15–25% | Clear access & routes |
| Truck Coordination | Prevent idle time | 1 excavator : 3–5 trucks |
| Bucket Selection | +30% | Match bucket to material |
| Operator Fatigue | −10–15% | Shift rotation |
| Utility Locates | −40–50% | Build verification time |
Benchmarking Excavation Performance
Contractors using telematics and job-cost tracking consistently report 12–18% efficiency gains within one year of implementation.
Key metrics to track:
- Cubic yards per hour
- CY per gallon of fuel
- Cycle time consistency
- Estimated vs. actual output
Requesting a Copy of This Report
Kitching Co. specializes in excavation and utility construction services throughout the region. Our experienced operators and well-maintained equipment fleet consistently achieve industry-leading productivity rates across residential, commercial, and municipal projects. Whether you need utility trenching, site preparation, or foundation excavation, we combine technical expertise with efficient execution to complete your project on time and on budget.
For a detailed project estimate or to discuss how our excavation services can support your upcoming project, contact Kitching Co today.
References
[1] Dig Robotics. (2025, January 27). Dig Robotics – what is the future of excavation? Retrieved from https://www.foundamental.com/perspectives/dig-robotics—what-is-the-future-of-excavation
[2] BC Ministry of Forests, Lands and Natural Resource Operations. (2010, January 27). Productivity Estimating Guide. Retrieved from https://www2.gov.bc.ca/assets/gov/farming-natural-resources-and-industry/forestry/timber-pricing/interior-timber-pricing/north_area_ece_productivity_estimating_guide.pdf
[3] Drahmedelyamany. (n.d.). Excavation Equipment: Shovel. Retrieved from http://drahmedelyamany.weebly.com/uploads/7/0/1/0/7010103/5-excavation_equipment-shovel-1.pdf


Leave a Reply
Want to join the discussion?Feel free to contribute!